

Acquisition Costs Compared for GreenSky, Square, PayPal, OnDeck, Lending Club, and Prosper
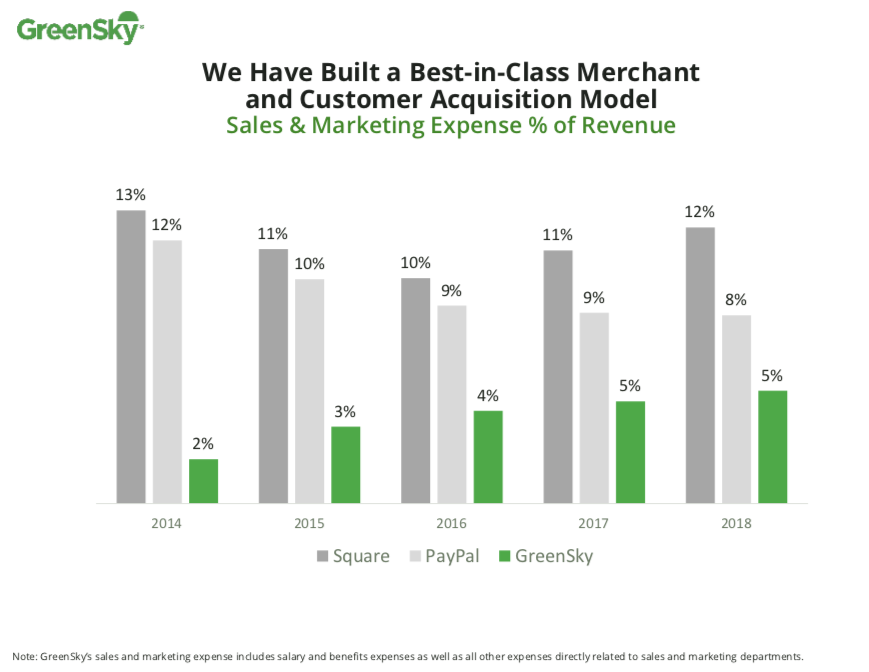 Greensky, a consumer lending company, wants investors to know how low its acquisition costs are relative to the competition. The chart above, which appeared in their year-end earnings report, showed how much lower their sales & marketing expense ratio is versus Square and PayPal.
deBanked examined three additional fintech lending companies and ranked them as follows:
| Company Name | 2018 Sales & Marketing Ratio | 2017 |
| GreenSky | 5% | 5% |
| PayPal | 8% | 9% |
| OnDeck | 11% | 15% |
| Square | 12% | 11% |
| Lending Club | 39% | 40% |
| Prosper Marketplace | 76%* | 72% |
*indicates an estimate
The closeness between Square and OnDeck is notable in that Square markets its payment services first and then offers loans (and other products) as an add-on, while OnDeck only offers loans. Despite that, sales & marketing as a percentage of revenue are still virtually the same for each of them. Square is outspending OnDeck on marketing by more than 10:1, however, and is on pace to surpass OnDeck’s annual loan volume.
Prosper, meanwhile, is doing just as poorly as its wacky ratio looks. The company is losing tens of millions of dollars a year with no end in sight.
Last modified: March 6, 2019