

Merchant Cash Advance Valuation Dynamics
Understanding the differences in cashflow dynamics between small business loans and MCAs is crucial for investors when valuing these alternative investments. A small business loan usually has familiar terms such as a principal amount that is paid back with interest over time, typically with a monthly payment schedule. An MCA agreement does not have these terms. Instead, the merchant agrees to sell a certain percentage of future revenues generated by the business, up to a specified “Purchased Amount,” to the funder in exchange for a lump sum of cash (the “Funded Amount”). MCAs often have an initially agreed-upon dollar amount that is debited daily by the funder via ACH. However, merchants have the ability to reconcile the total debited at the end of each month based on their actual sales activity and the agreed-upon percentage. If the merchant’s sales are slower than projected, the MCA company owes the merchant back a portion of the month’s debits to be in line with the contractual percentage of sales, and the daily ACH amount may be adjusted.
The preferred approach for valuing MCAs is discounted cashflow analysis. Given the nuances of MCA cash flow dynamics, modeling should be done individually for each MCA. Projections should be modeled using assumptions that are supportable from historical data and the methodologies used should be transparent. This modeling should incorporate not only the cash flow from the merchant, but also the cash flows arising from deal mechanics such as commissions paid, origination fees and ongoing fees as well as expected charge-offs. Since the funder cannot know for certain which merchants will realize revenues higher or lower than projected or default when underwriting the MCA, any attempt at an accurate projection of future cash flows must incorporate probabilities for scenarios where the timing and amount of cash flows is different than the underwritten scenario. Because businesses in a particular sector may have similar historical cash flow behavior, each MCA should be analyzed based on the historical experience of MCAs with similar characteristics such as business type, advance amount and purpose for taking out the MCA. A smaller but related issue is incorporating the probability that the merchant chooses to pay off the Purchased Amount via a lump sum payment and negotiates a discount to the Purchased Amount.
Examining payment behavior involves creating payment curves that compare the cash flow received at each point in time, expressed as a percentage of the Purchased Amount, to the cash flow projected to have been received at that time during underwriting. This curve is the “Cash Flow Curve,” and its steepness is the “Cash Flow Speed.” More specifically, the Cash Flow Speed is the cash flow received to date divided by the cash flow projected to be received as of that date during underwriting. A perfectly underwritten MCA would be one on which no reconciliations are made and each daily ACH goes through without issues, meaning that all of the Purchased Amount was received exactly as originally projected, and its Cash Flow Speed would be 100.0% every day. As with most things, this does not work in practice like it does in theory. Some merchants will have ACHs which fail, make additional payments to make up for failed ACHs, renegotiate the daily ACH amount as part of a reconciliation or after a failed ACH, turn off ACH completely or have other issues. Analyzing the Cash Flow Curve for each MCA and comparing it to its cohort is essential to understanding performance drivers when projecting future cash flows.
To illustrate a possible MCA agreement, assume a merchant sells $70,000 of future sales (the Purchased Amount) to the funder for $50,000 (the Funded Amount). The Purchased Amount is to be received via ACH daily, with $500 debited per day for the next 140 business days based on projected revenues. In this example, the Gross Factor is 1.40, i.e. $70,000 divided by $50,000. Assuming that the funder pays a commission of 8% of the Funded Amount, the Funder’s Cost is $54,000, and the Net Factor is 1.30, i.e. $70,000 divided by $54,000. The graph below illustrates some possibilities of what the actual Cash Flow Curves might be.
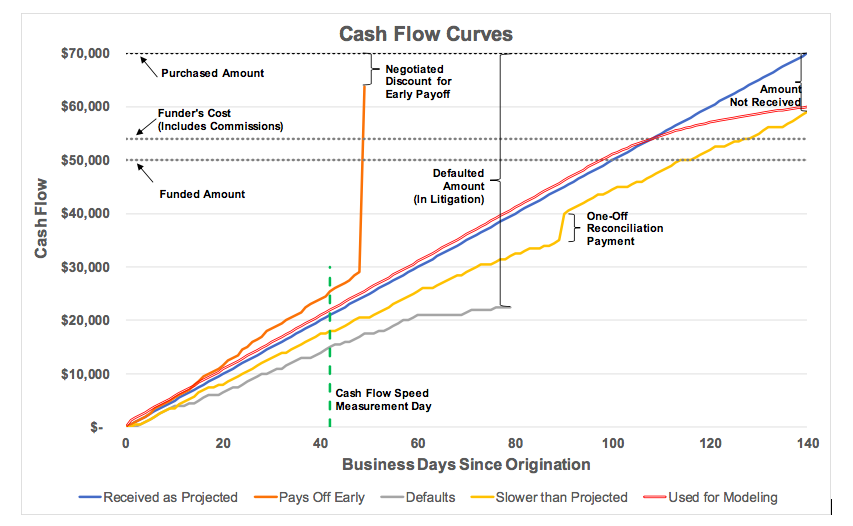
Received as Projected: depicts an MCA where debits via ACH are received each day, and the ACH is unchanged until the full Purchased Amount is received. Its Cash Flow Speed at the measurement day (and every day) is 100.0%.
Pays Off Early: depicts an MCA where the merchant elects to send additional cash flow to the funder, eventually negotiating to pay off the MCA early after 49 business days with a discount to the Purchased Amount negotiated with the funder. Its Cash Flow Speed at the measurement day is 121.4%.
Defaults: depicts and MCA where the ACH debit fails with increasing frequency until the bank account is closed and the funder takes the merchant into litigation for the remaining Purchased Amount (the “Defaulted Amount”). Note that the funder may be entitled to recoup amounts beyond the Defaulted Amount in litigation. Its Cash Flow Speed at the measurement day is 71.4%.
Slower than Projected: depicts an MCA where ACH fails sometimes, but the merchant does not shut down and the funder receives cash flow slower than projected. An example of a one-off reconciliation payment is included, assuming the merchant had not been paying in accordance with the contract and agreed to make a “catch-up” payment. After 140 days only $59,000, or 84.3% of the $70,000 Purchased Amount, has been received, although the funder would likely still expect to recoup most or all of the remaining Purchased Amount. Its Cash Flow Speed at the measurement day is 85.7%.
Used for Modeling: When analyzing this MCA on day 0, before any cash flow behavior is known, each of these possibilities (as well as others) would be incorporated into the analysis on a probability-weighted basis. An example of a probability-weighted average Cash Flow Curve is shown. After 140 days 85.7% of the Purchased Amount has been received, although cash flow is assumed to continue to be received until 210 days (150% of the underwritten projection), with 90.3% of the Purchased Amount received by then. Its Cash Flow Speed at the measurement day is 104.6%.
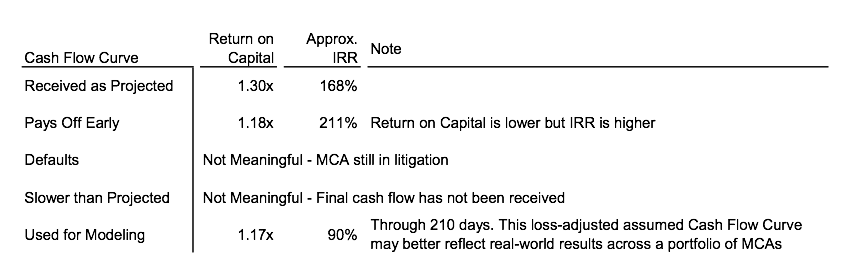
Based on the Funder’s Cost, the chart below shows some return metrics based on these Cash Flow Curves.
As the industry matures and attracts more capital from institutional investors, it is increasingly important to have clearly defined metrics in place to evaluate underwriting effectiveness, assess relative credit performance of originators or cohorts of MCAs, and to perform valuations. Standardizing on terms such as Funded Amount, Purchased Amount, Gross Factor, and Net Factor and concepts such as Cash Flow Curve and Cash Flow Speed should ease the understanding of MCAs by eliminating ambiguity amongst various participants in the industry.
Last modified: November 20, 2019Gunes Kulaligil (gkulaligil@methodicalmgmt.com) is a co-founder of Methodical Management, a New York based firm providing valuations, transaction advisory and due diligence services to lenders and investors active in the specialty finance sector. www.methodicalmgmt.com