

Articles by Fernando Pedrero

An OnDeck (ONDK) Technical Analysis
July 12, 2015For some of us working in the merchant cash advance industry, we saw the IPO of OnDeck (ONDK) as a major stepping stone in getting recognized by main street and receiving overall exposure. Unfortunately it has not been the best representative of us in the stock market. I started monitoring ONDK on the first day it started to trade and after 7 months, it clearly hasn’t looked positive.
I am a student in technical analysis. In layman’s terms, it is the study of price action of a traded financial instrument to make an informed investment decision. The following is my view.
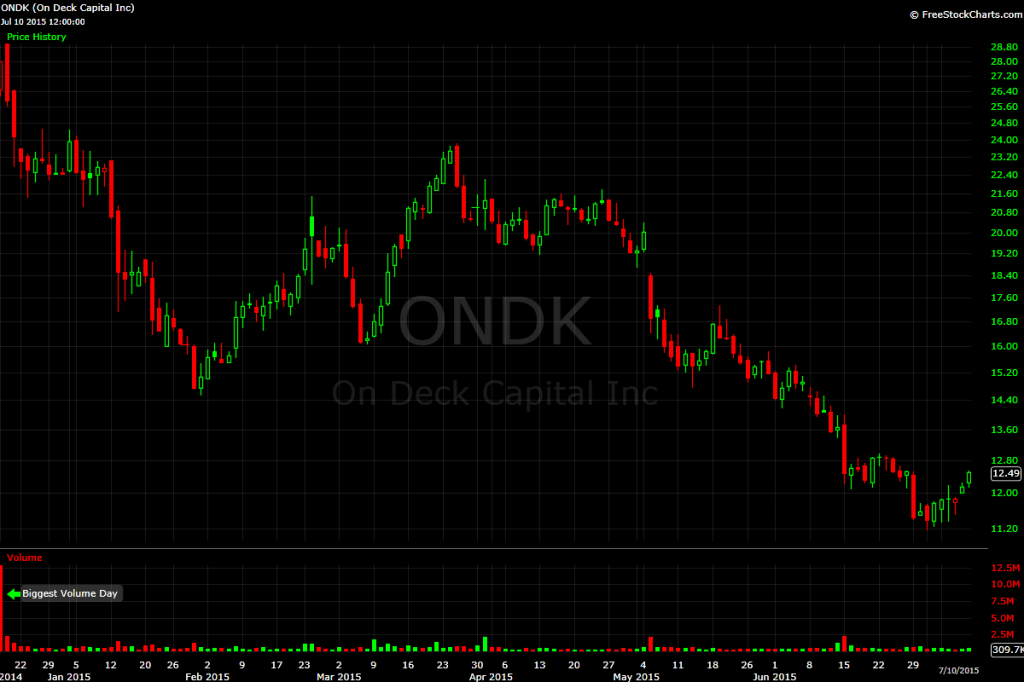
The first thing that pops out when viewing the chart is that the single biggest day of volume (number of shares traded) was the IPO day. The stock has yet to trade in that kind of volume since then.
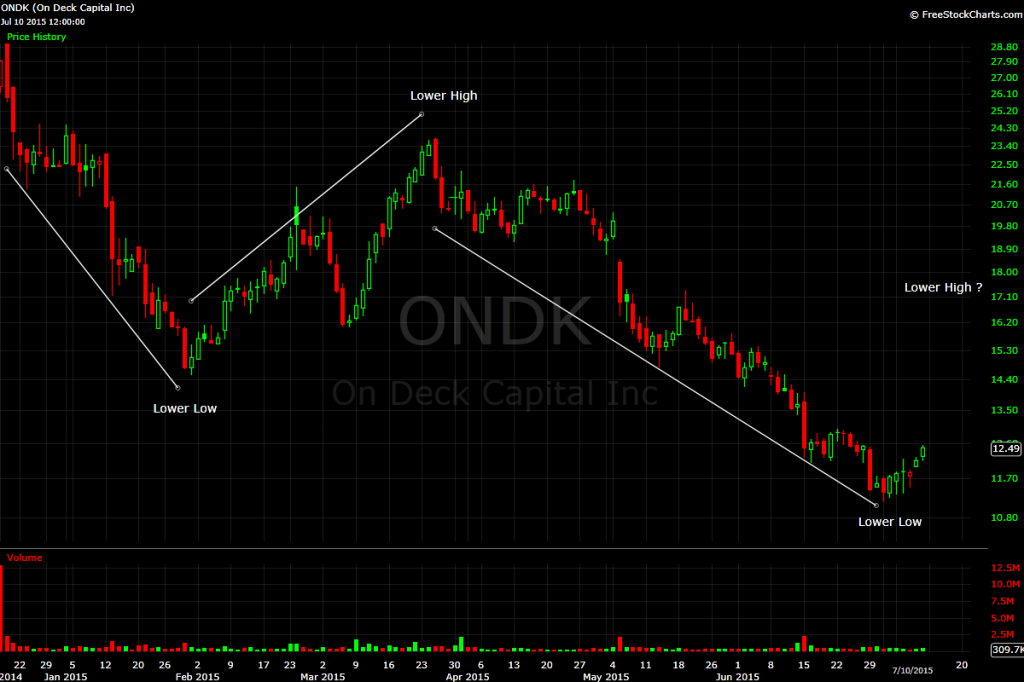
The other obvious thing that pops out is that the stock has been in downtrend, a series of lower lows and lower highs. As the old Wall Street adage says, “The trend is your friend.” Trying to call a bottom in this stock has been useless as it seems like those that have, are catching a falling knife.

Moving averages are used to determine whether the stock is trending or not. With very few trading days the longer term averages are not able to be rendered. In May the stock met resistance at the 20/50 EMA crossover. Coincidentally this was also the beginning of the latest down leg. It is also worth noting that the stock has not closed above the 20 day EMA since it was breached. There was one failed attempt that resulted in the continuation of the down trend in the middle of May. The stock is currently at the 20 EMA and is testing this level again. A close above this could be an indication of a possible change in trend.
The bottom of the chart has the RSI. This is a measurement of Overbought and Oversold conditions, which is telling us that the stock has been oversold for a couple of months. It recently started moving upward from the oversold condition.
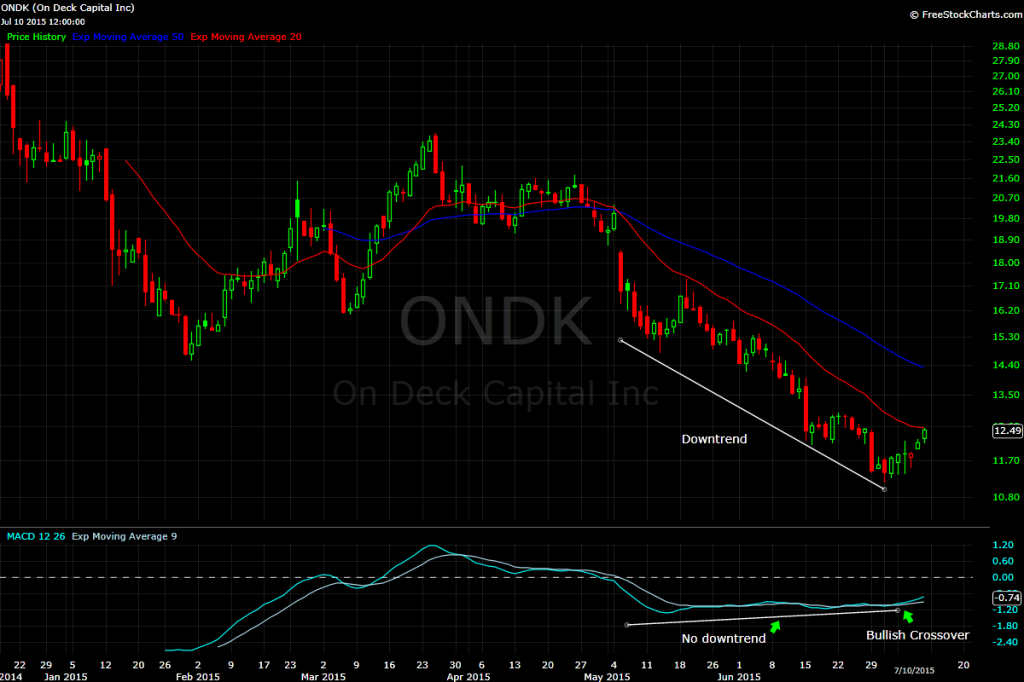
The MACD is another technical indicator used. It measures the momentum of the stock. I like to think of momentum as the thrust/force of the move in a stock. This indicator points two things to me. As the stock has been going lower there hasn’t been a lower low in the indicator. It actually seems there is a slight uptrend in the indicator, which tells me as the stock has gone lower, there hasn’t been the same force/thrust to the move. This is a classic example of divergence, meaning the stock is doing one thing while the momentum indicator is doing another.
The information above points to two possibilities. The first is that the stock is currently taking a breather from its downtrend. This is normal in a stock cycle; after all, stocks do not go up or down in straight lines. The other is that the stock could be in the beginning stages of stabilizing. Stabilizing does not mean that the stock will begin a new uptrend. It means the stock could be range bound for a couple of months.


