

Lending Club Performance Data Has Obvious Errors, Investors Say
There’s something wrong with the returns Lending Club is dangling in front of investors, some diligent note buyers say. And the numbers are so far off, that it’s being chalked up as a bug, instead of something nefarious.
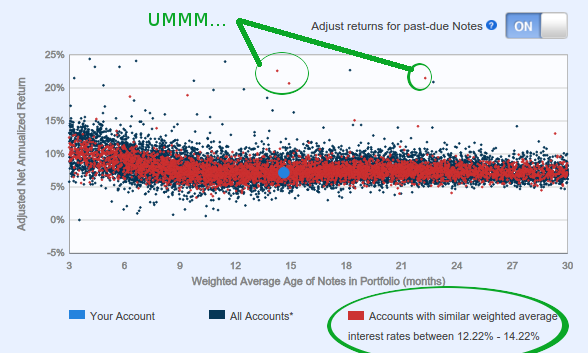
On the “Understanding Your Returns” page, investors can view how their portfolio stacks up against all others on the platform with the same weighted average interest rate. Most investors will end up somewhere in the middle, but a few are outperforming the rest with seemingly impossible results.
The flawed chart, which I could duplicate myself, shows investors supposedly making over 20% annual returns on seasoned portfolios where the weighted average interest rate of notes is between 12.22% and 14.22%. But how can an overall return be so much greater than the interest rates that make up the portfolio? They can’t be. But Lending Club’s chart tells a different tale.
With projected defaults, the adjusted returns should be lower than the weighted average interest rate, certainly not much higher and definitely not double.
On the Lend Academy forum where this was noticed, at least one investor said they emailed Lending Club on March 18th to alert them to the impossible performance data.
For now, the page that is meant to help investors understand their returns, is doing anything but.
Update 3/22: Lending Club has reportedly told an investor asking about this discrepancy that it is indeed a bug and will be fixed.
Update 3/24: This has mostly been fixed
Last modified: March 25, 2016Sean Murray is the President and Chief Editor of deBanked and the founder of the Broker Fair Conference. Connect with me on LinkedIn or follow me on twitter. You can view all future deBanked events here.